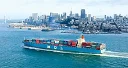
Mitsui O.S.K. Lines company profile
Company profile
Mitsui O.S.K. Lines has 11,567 employees and is headquartered in Minato, Japan.
Ocean Network Express and Auto Carrier Express are the names customers meet most often on Mitsui O.S.K. Lines' container and car carrier services, which sit alongside dry bulk shipping of iron ore, coal, wood chips and fertilizers, oil tankers and LNG carriers, ferries, cruise ships and container terminal management. The group also runs logistics services including freight forwarding, trucking, customs clearance and warehousing, as well as land and office leasing, tugboat operations and maritime consulting. Its activities cover Japan, North America, Europe, Singapore and other international markets.
In the fiscal year ended March 2026, revenue reached 1,825.1 billion yen, up 2.8% from the previous year, and net income was 213.3 billion yen. The company employed 11,567 people and is headquartered in Minato, Japan. It was founded in 1884.
Company facts
- Sector
- Industrials
- Industry
- Marine Shipping
- Country
- Japan
- Headquarters
- Shosen Mitsui Building, 105-8688, Minato
- Employees
- 11,567
- Chief executive
- Jotaro Tamura
- Founded
- 1884
- Fiscal year
- April - March
- Listing
- 9104 · TSE
- Indices
- Nikkei 225
- Currency
- JPY
- ISIN
- JP3362700001
- Website
- mol.co.jp
Mitsui O.S.K. Lines and its competitors
The most similar companies by business and size
| Company | Country | Market cap | Employees | Operating margin | P/E (trailing 12 months) |
|---|---|---|---|---|---|
| Mitsui O.S.K. Lines9104 | Japan | $13.97B | 11,567 | 5.7% | 8.02 |
| SITC International Holdings1308 | Hong Kong SAR China | $14.09B | 2,438 | 33.5% | 11.2 |
| COSCO SHIPPING Holdings601919 | China | $14.18B | 32,768 | 16.8% | 10.0 |
| Evergreen Marine Corporation (Taiwan)2603 | Taiwan | $15.27B | 200 | 20.7% | 6.36 |
| HMM011200 | South Korea | $15.6B | 1,863 | 18.0% | 13.9 |
| Orient Overseas (International)0316 | Hong Kong SAR China | $12.59B | 8,770 | 9.0% | 9.82 |
Competitors: same or related industry, same region first, then the closest market capitalization. Market cap converted into US dollars at the latest exchange rates; P/E over the last 12 months, not shown when negative.