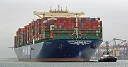
HMM company profile
Company profile
HMM has 1,863 employees and is headquartered in Seoul, South Korea.
Container shipping is the largest part of the business at HMM, which carries general, refrigerated, oversized and hazardous cargo on its container fleet. Its vessels also include bulk carriers, Cape, Panamax, Supramax and Handy trampers, crude and product tankers, LNG carriers and heavy-lift ships. Beyond sea transport, the company runs container terminals, moves cargo by rail, barge and truck, and offers digital tools such as the Hi-Quote booking platform and HMM eBL to customers in Japan and abroad.
In the fiscal year ended December 2025, revenue reached 10.9 trillion won, down 6.9% from the previous year, and net income was 1.9 trillion won. The company had 1,863 employees and is headquartered in Seoul, South Korea. Founded in 1976 as Hyundai Merchant Marine, it took the name HMM Co.,Ltd in March 2020.
Company facts
- Sector
- Industrials
- Industry
- Marine Shipping
- Country
- South Korea
- Headquarters
- Tower 1, Parc.1, 07335, Seoul
- Employees
- 1,863
- Chief executive
- Won Hyok Choi
- Founded
- 1976
- Fiscal year
- January - December
- Listing
- 011200 · KRX
- Currency
- KRW
- ISIN
- KR7011200003
- Website
- hmm21.com
HMM and its competitors
The most similar companies by business and size
| Company | Country | Market cap | Employees | Operating margin | P/E (trailing 12 months) |
|---|---|---|---|---|---|
| HMM011200 | South Korea | $15.57B | 1,863 | 10.7% | 13.9 |
| SITC International Holdings1308 | Hong Kong SAR China | $15.83B | 2,438 | 33.5% | 12.4 |
| Mitsui O.S.K. Lines9104 | Japan | $14.74B | 11,567 | 5.6% | 8.50 |
| Evergreen Marine Corporation (Taiwan)2603 | Taiwan | $16.87B | 200 | 20.7% | 7.00 |
| Nippon Yusen Kabushiki Kaisha9101 | Japan | $17.15B | 39,830 | 6.8% | 8.96 |
| COSCO SHIPPING Holdings601919 | China | $13.64B | 32,768 | 16.8% | 9.79 |
Competitors: same or related industry, same region first, then the closest market capitalization. Market cap converted into US dollars at the latest exchange rates; P/E over the last 12 months, not shown when negative.