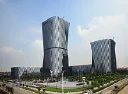
Midea Group company profile
Company profile
Midea Group has 198,570 employees and is headquartered in Foshan, China.
Midea Group Co., Ltd., based in Foshan, China, where it was founded in 1968, manufactures and sells electrical appliances in China and abroad. Its home products include air conditioners, kitchen appliances, refrigerators and washing machines, along with heating and ventilation systems and various small appliances. Its commercial and industrial operations supply elevators, frequency converters, medical imaging products, robots and automation systems, and it also provides Internet of Things solutions. Its businesses further include a smart supply chain, wholesale of household appliance raw materials and financial services such as consumer credit and financial leasing.
In the fiscal year ended December 2025, Midea reported revenue of 456.5 billion yuan, up 12.1% from the previous year, and net income of 43.9 billion yuan. The group employed 198,570 people, and its headquarters are in Foshan. Its shares are also traded on the Hong Kong Stock Exchange.
Company facts
- Sector
- Consumer
- Industry
- Furnishings, Fixtures & Appliances
- Country
- China
- Headquarters
- Midea Headquarters Building, 528311, Foshan
- Employees
- 198,570
- Chief executive
- Jianguo Wang
- Founded
- 1968
- Fiscal year
- January - December
- Listing
- 000333 · SZSE
- Currency
- CNY
- ISIN
- CNE100001QQ5
- Website
- midea.com.cn
Midea Group and its competitors
The most similar companies by business and size
| Company | Country | Market cap | Employees | Operating margin | P/E (trailing 12 months) |
|---|---|---|---|---|---|
| Midea Group000333 | China | $106.83B | 198,570 | 9.7% | 14.9 |
| Gree Electric Appliances, Inc. of Zhuhai000651 | China | $34.35B | 71,966 | 16.4% | 9.10 |
| Haier Smart Home600690 | China | $29.61B | 134,995 | 6.8% | 11.2 |
| Guangdong Songfa Ceramics603268 | China | $25.64B | 6,830 | 22.3% | 23.9 |
| King Slide Works2059 | Taiwan | $20.63B | — | 78.7% | 44.6 |
| Nitori Holdings9843 | Japan | $11.94B | 19,432 | 13.5% | 21.4 |
Competitors: same or related industry, same region first, then the closest market capitalization. Market cap converted into US dollars at the latest exchange rates; P/E over the last 12 months, not shown when negative.