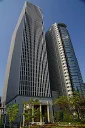
Asahi Kasei company profile
Company profile
Asahi Kasei has 47,895 employees and is headquartered in Chiyoda, Japan.
With 47,895 employees, the group reported revenue of 3,074.5 billion yen in the fiscal year ended March 2026, up 1.2% from the previous year, and net income of 158.8 billion yen for the same period. Founded in 1922, the company has its head office in Chiyoda, Japan.
The group works across three areas: materials, homes and healthcare. In materials, it supplies lithium-ion battery separators under the Celgard name, photoresists and polyimide materials for semiconductor manufacturing, membranes for water treatment and caustic soda production, and fibers such as Bemberg and ROICA. Its consumer lines include Saran Wrap and Ziploc cling film and bags. The healthcare unit offers prescription drugs, virus removal filters and wearable defibrillators. The homes business builds unit homes, apartment buildings and autoclaved aerated concrete products, and it also runs overseas housing and real estate activities. Its main markets are Japan, the US and China, plus other countries.
Company facts
- Sector
- Industrials
- Industry
- Conglomerates
- Country
- Japan
- Headquarters
- Hibiya Mitsui Tower, 100-0006, Chiyoda
- Employees
- 47,895
- Chief executive
- Koshiro Kudo
- Founded
- 1922
- Fiscal year
- April - March
- Listing
- 3407 · TSE
- Indices
- Nikkei 225
- Currency
- JPY
- ISIN
- JP3111200006
- Website
- asahi-kasei.com
Asahi Kasei and its competitors
The most similar companies by business and size
| Company | Country | Market cap | Employees | Operating margin | P/E (trailing 12 months) |
|---|---|---|---|---|---|
| Asahi Kasei3407 | Japan | $12.38B | 47,895 | 8.8% | 10.3 |
| Hikari Tsushin9435 | Japan | $11B | 4,012 | 15.3% | 11.8 |
| Kawasaki Heavy Industries7012 | Japan | $8.42B | 39,689 | 6.6% | 11.0 |
| SK034730 | South Korea | $18.81B | 4,273 | 6.4% | 3.51 |
| SGHSGH | Australia | $21.36B | 10,607 | 11.9% | 25.0 |
| InfratilIFT | Australia | $7.3B | 7,076 | 1.7% | 48.4 |
Competitors: same or related industry, same region first, then the closest market capitalization. Market cap converted into US dollars at the latest exchange rates; P/E over the last 12 months, not shown when negative.