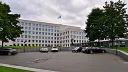
A.P. Møller - Mærsk company profile
Company profile
A.P. Møller - Mærsk has 100,000 employees and is headquartered in Copenhagen, Denmark.
Operating in Denmark and internationally, A.P. Møller - Mærsk A/S runs an integrated logistics business that moves cargo by ocean, inland, air and ground. Its Ocean, Logistics & Services and Terminals segments cover less-than-container freight, warehousing and distribution, customs clearance, e-commerce logistics and lead logistics. Cold chain offerings, including pharmaceutical cold storage, sit alongside vessel chartering, specialized airlift, project orchestration and value-added handling such as labelling, kitting and reverse logistics. Its customers come from consumer goods, apparel, retail, chemicals, automotive, technology, pharmaceuticals and healthcare, and perishable food sectors.
In the fiscal year ended December 2025, the group reported revenue of USD 54.0 billion, a decline of 2.7% on the previous year, and net profit of USD 2.7 billion. It employed 100,000 people. The company was founded in 1904 and is headquartered in Copenhagen, Denmark.
Company facts
- Sector
- Industrials
- Industry
- Marine Shipping
- Country
- Denmark
- Headquarters
- Esplanaden 50, 1263, Copenhagen
- Employees
- 100,000
- Chief executive
- Vincent Clerc
- Founded
- 1904
- Fiscal year
- January - December
- Listing
- MAERSK.B · Nasdaq Copenhagen
- Currency
- DKK
- ISIN
- DK0010244508
- Website
- maersk.com
A.P. Møller - Mærsk and its competitors
The most similar companies by business and size
| Company | Country | Market cap | Employees | Operating margin | P/E (trailing 12 months) |
|---|---|---|---|---|---|
| A.P. Møller - MærskMAERSK.B | Denmark | $42.78B | 100,000 | 7.9% | 10.7 |
| Hapag-LloydHLAG | Germany | $24.82B | 15,172 | 5.1% | 29.1 |
| Wallenius WilhelmsenWAWI | Norway | $7.54B | 12,000 | 18.0% | 10.9 |
| HafniaHAFNI | Norway | $5.03B | 4,000 | 22.1% | 7.08 |
| Wilh. Wilhelmsen HoldingWWI | Norway | $3.87B | 19,895 | 11.2% | 7.18 |
| Höegh AutolinersHAUTO | Norway | $3.66B | 1,763 | 30.1% | 8.05 |
Competitors: same or related industry, same region first, then the closest market capitalization. Market cap converted into US dollars at the latest exchange rates; P/E over the last 12 months, not shown when negative.