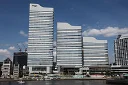
JGC Holdings company profile
Company profile
JGC Holdings has 8,154 employees and is headquartered in Yokohama, Japan.
Engineering services for energy and chemical plants are at the core of the group's activity: planning, design, procurement, construction and commissioning of facilities for petroleum, refining, petrochemicals, gas and liquefied natural gas. A second segment, Functional Materials Manufacturing, makes catalysts, nanoparticle products, hygiene and safety materials, electronic materials and high-performance ceramics for next-generation energy uses. Beyond these, the group offers consulting, real estate management and water desalination, and sells oil and gas. Its markets span Japan, Southeast Asia, the Middle East, Africa, North America and other international regions.
In the fiscal year ended March 2026, revenue was 745.3 billion yen, down 13.1% from the previous year, and net income reached 41.8 billion yen. The group employs 8,154 people and is headquartered in Yokohama, Japan. It was incorporated in 1928 and adopted its current name in October 2019.
Company facts
- Sector
- Industrials
- Industry
- Engineering & Construction
- Country
- Japan
- Headquarters
- 2-3-1, Minato Mirai, 220-6001, Yokohama
- Employees
- 8,154
- Chief executive
- Masayuki Sato
- Founded
- 1928
- Fiscal year
- April - March
- Listing
- 1963 · TSE
- Indices
- Nikkei 225
- Currency
- JPY
- ISIN
- JP3667600005
- Website
- jgc.com
JGC Holdings and its competitors
The most similar companies by business and size
| Company | Country | Market cap | Employees | Operating margin | P/E (trailing 12 months) |
|---|---|---|---|---|---|
| JGC Holdings1963 | Japan | $3.28B | 8,154 | 5.6% | 10.9 |
| Downer EDIDOW | Australia | $3.17B | 22,800 | 4.6% | 22.0 |
| COMSYS Holdings1721 | Japan | $3.76B | 17,765 | 8.5% | 14.9 |
| Monadelphous GroupMND | Australia | $2.32B | 7,482 | 5.7% | 26.9 |
| SrgSRG | Australia | $1.47B | 4,959 | 6.7% | 31.2 |
| Hyundai Engineering & Construction000720 | South Korea | $7.04B | 4,652 | 2.2% | 31.6 |
Competitors: same or related industry, same region first, then the closest market capitalization. Market cap converted into US dollars at the latest exchange rates; P/E over the last 12 months, not shown when negative.