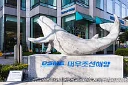
Hanwha Ocean company profile
Company profile
Hanwha Ocean has 9,691 employees and is headquartered in Geoje-Si, South Korea.
Hanwha Ocean is best known for its LNG carriers, container ships and tankers, as well as FLNG units, drilling rigs and FPSO vessels for offshore oil and gas production. Its activities extend to engineering and construction of commercial and residential buildings, infrastructure and power plants, and to defense products such as artillery systems, armored vehicles, air defense systems and precision-guided munitions. The group also makes space launch vehicle engines, ship engines, industrial explosives, petrochemicals and fuels, and offers insurance, asset management and securities services, serving customers in South Korea and abroad.
In the fiscal year ended December 2025, revenue reached 12.8 trillion won, up 18.6% from the previous year, and net income was 1.2 trillion won. The company employed 9,691 people. Founded in 1952, it is headquartered in Geoje-si, South Korea.
Company facts
- Sector
- Industrials
- Industry
- Aerospace & Defense
- Country
- South Korea
- Headquarters
- 3370, Geoje-daero, Geoje-Si
- Employees
- 9,691
- Chief executive
- Hee Cheul Kim
- Founded
- 1952
- Fiscal year
- January - December
- Listing
- 042660 · KRX
- Currency
- KRW
- ISIN
- KR7042660001
- Website
- hanwhaocean.com
Hanwha Ocean and its competitors
The most similar companies by business and size
| Company | Country | Market cap | Employees | Operating margin | P/E (trailing 12 months) |
|---|---|---|---|---|---|
| Hanwha Ocean042660 | South Korea | $10.27B | 9,691 | 12.4% | 11.9 |
| Samsung Heavy Industries010140 | South Korea | $10.23B | 8,377 | 9.8% | 32.5 |
| HD Korea Shipbuilding & Offshore Engineering009540 | South Korea | $12.22B | 1,677 | 15.5% | 5.26 |
| Korea Aerospace Industries047810 | South Korea | $7.47B | 4,791 | 5.7% | 57.3 |
| Hanwha Systems272210 | South Korea | $7B | 4,783 | 4.6% | 76.9 |
| LIG Defense&Aerospace079550 | South Korea | $5.75B | 5,421 | 8.6% | 54.0 |
Competitors: same or related industry, same region first, then the closest market capitalization. Market cap converted into US dollars at the latest exchange rates; P/E over the last 12 months, not shown when negative.