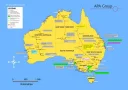
APA Group company profile
Company profile
APA Group has 2,700 employees and is headquartered in Sydney, Australia.
Customers and markets: APA Group serves gas and electricity users across Australia, supplying energy through a network of pipelines, transmission lines and related infrastructure. Its gas transmission business covers high-pressure pipelines and interconnected gas grids, along with gas processing, compression and storage. On the electricity side it operates interconnectors, including deep-sea cable, and battery storage systems. The group also holds gas-fired power generation, solar farms, wind farms and microgrid services, and it provides asset management services for energy infrastructure. Its activity is organised into Energy Infrastructure, Asset Management and Energy Investments segments.
In the fiscal year ended June 2026, APA Group reported revenue of AUD 3.0 billion, down 6.3% from the previous year, and net profit of AUD 207 million. The company had 2,700 employees and is headquartered in Sydney, having been incorporated in 2007.
Company facts
- Sector
- Utilities
- Industry
- Utilities - Regulated Gas
- Country
- Australia
- Headquarters
- 121 Castlereagh Street, 2000, Sydney
- Employees
- 2,700
- Chief executive
- Adam Watson
- Founded
- 2007
- Fiscal year
- July - June
- Listing
- APA · ASX
- Indices
- S&P/ASX 200
- Currency
- AUD
- ISIN
- AU000000APA1
- Website
- apa.com.au
APA Group and its competitors
The most similar companies by business and size
| Company | Country | Market cap | Employees | Operating margin | P/E (trailing 12 months) |
|---|---|---|---|---|---|
| APA GroupAPA | Australia | $9.99B | 2,700 | 35.6% | 70.3 |
| Tokyo Gas9531 | Japan | $13.46B | 16,001 | 7.0% | 11.5 |
| Osaka Gas9532 | Japan | $13.58B | 21,835 | 6.9% | 18.1 |
| GAIL (India)GAIL | India | $13.58B | 5,356 | 9.9% | 9.97 |
| ENN Energy Holdings2688 | Hong Kong SAR China | $6.94B | 32,439 | 7.3% | 7.94 |
| Hong Kong and China Gas0003 | Hong Kong SAR China | $17.35B | 54,076 | 14.1% | 21.4 |
Competitors: same or related industry, same region first, then the closest market capitalization. Market cap converted into US dollars at the latest exchange rates; P/E over the last 12 months, not shown when negative.